
A result written as 20.03 looks more authoritative than one written as about 20. Yet extra digits do not explain the instrument, the procedure or the sources of variation. A measurement becomes informative when the number arrives with enough context to understand what it means.
Uncertainty is part of that context. It is not an apology attached to otherwise perfect science, nor a convenient way to dismiss a result. It describes the limits of the measurement under a stated set of information. A small classroom-style example makes the distinction concrete.
Decide what is being measured
Suppose we want the length of a rectangular card. Which edges define the length? Is the card lying flat? Are we measuring at the top, centre or bottom? A slightly irregular object can produce different results even when everyone uses the ruler correctly.
These questions define the quantity being measured. They are not pedantic additions after the “real” work. If two people measure different features, averaging their numbers does not repair the mismatch. A useful record begins with an operational description that another person could follow.
For our fictional exercise, let the task be the distance between two marked points on a card lying flat on a table. We use the same ruler and read it from directly above. Nothing here is a reported laboratory experiment; the numbers below are invented to illustrate the reasoning.
What repeated readings show
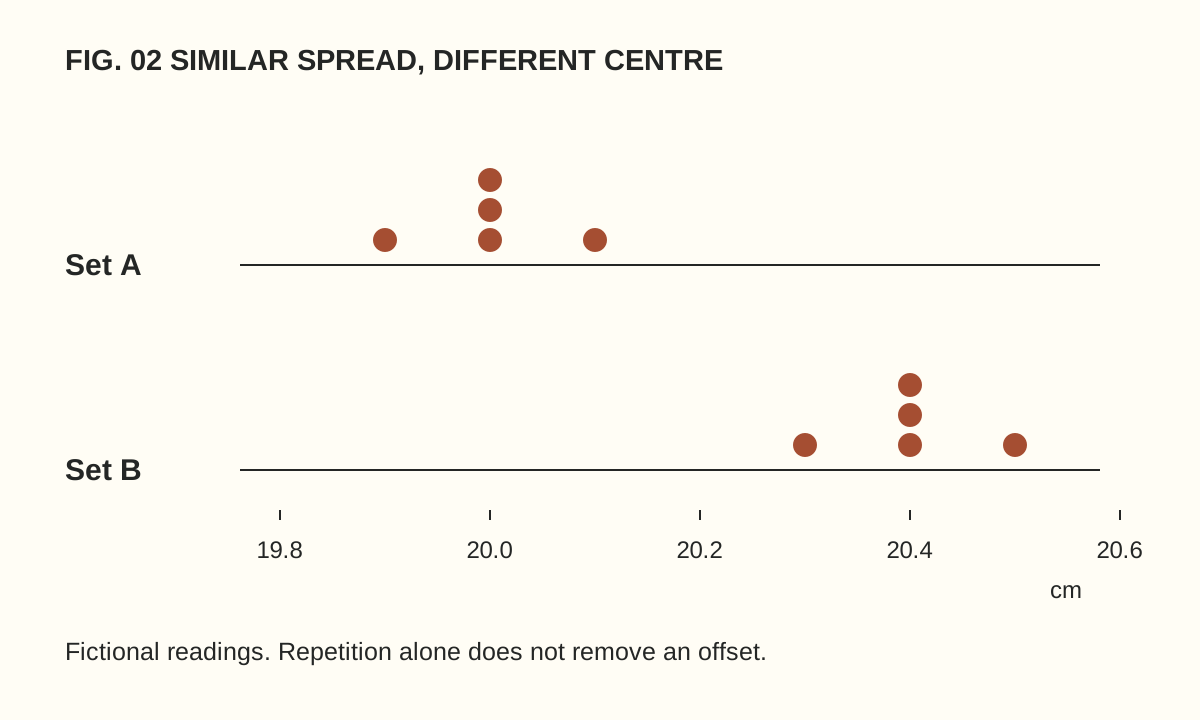
Imagine readings of 20.0, 20.1, 20.0, 19.9 and 20.0 centimetres. Their mean is 20.0 cm. The small spread tells us something about variation under this particular procedure. It does not establish that the ruler’s scale is correct or that the marked points represent the feature we intended to measure.
Now imagine a second set: 20.4, 20.5, 20.4, 20.3 and 20.4 cm. It has a similar spread but a different centre. If the ruler’s zero were displaced, repeated careful readings might remain consistently shifted. Agreement among repeats is therefore not the same thing as agreement with a trustworthy reference.
NIST’s definition of measurement uncertainty explicitly includes contributions associated with systematic effects as well as components assessed from repeated observations. This is why “we measured it five times” is useful information but not a complete uncertainty statement.
Averaging cannot fix every problem
When repeated observations contain suitably independent random variation, averaging can reduce the contribution of that variation to uncertainty in the mean. But repeating an unchanged offset does not make the offset disappear. Ten copies of the same mistake are still a mistake.
In the fictional card exercise, imagine every reading is increased by 0.4 cm because of a known scale offset. Averaging more readings around 20.4 cm will not magically approach 20.0 cm. A correction and its own uncertainty must be considered if the offset has been established appropriately.
NIST’s guidelines for expressing measurement results describe a structured treatment of contributions rather than using repetition as a universal remedy. Our example is deliberately simpler than a formal uncertainty budget, but it identifies why several sources of information may be needed.
Instrument resolution is one contribution
The smallest displayed increment constrains what can be read directly, but it is not automatically the total uncertainty. A digital display can show many digits while the underlying measurement remains affected by calibration, environment, sampling or the method.
Think of a bathroom scale that changes its final digit as an object is repositioned. The final digit is an observation about the display. To understand the measurement, one would also need to consider the instrument’s documented performance and the procedure. The same distinction applies to sophisticated equipment, though the analysis becomes more detailed.
For the card, write down the ruler’s graduations, the reading method and any visible damage. If a worn end cannot serve as a reliable zero, do not simply conceal that fact with more decimal places. Changing the method may be more valuable than collecting another page of nearly identical readings.
Read an interval with its label
A plus-or-minus symbol needs an explanation. Does it describe a standard uncertainty, an expanded uncertainty with a stated coverage factor, a confidence interval from a particular statistical procedure, or simply the observed range? Those statements are not interchangeable.
Do not assume that every interval means the true value is guaranteed to lie inside it. The interpretation depends on the method and assumptions. If a report omits that information, the right response is to ask for the definition rather than attach a familiar percentage yourself.
Likewise, two intervals overlapping or failing to overlap is not a universal significance test. Relationships between measurements, shared systematic effects and the intended comparison matter. A graph can be an excellent summary, but the caption and methods tell you how its bars should be read.
A small uncertainty notebook
For a harmless everyday measurement, create five headings: quantity, method, observations, possible influences and reporting choice. Under influences, distinguish things you investigated from things you merely suspect. “Ruler end visibly worn” is an observation; “temperature might matter” is a question unless you have evaluated its relevance.
Report the result at a sensible precision and keep the original readings. Do not round intermediate calculations repeatedly if that would alter the final result, and do not manufacture extra digits to make the report look sophisticated. The notebook’s value lies in making reasoning inspectable.
Try asking someone else to repeat the written procedure. A difference may reveal an ambiguous instruction before it reveals anything about the object. That is useful scientific work: improving the definition and method, rather than treating disagreement as an embarrassment.
Why this matters when reading science
A reported change can be smaller than the relevant measurement uncertainty, or it can be robust despite modest-looking precision. Without the method, the number alone cannot settle that question. In our exoplanet example, uncertainty in the star affects what can be inferred about the planet.
The strongest reading habit is therefore simple: look for the quantity, the procedure and the meaning of the uncertainty together. A carefully bounded claim is often more useful than a dramatic number with its limitations removed.